


  |
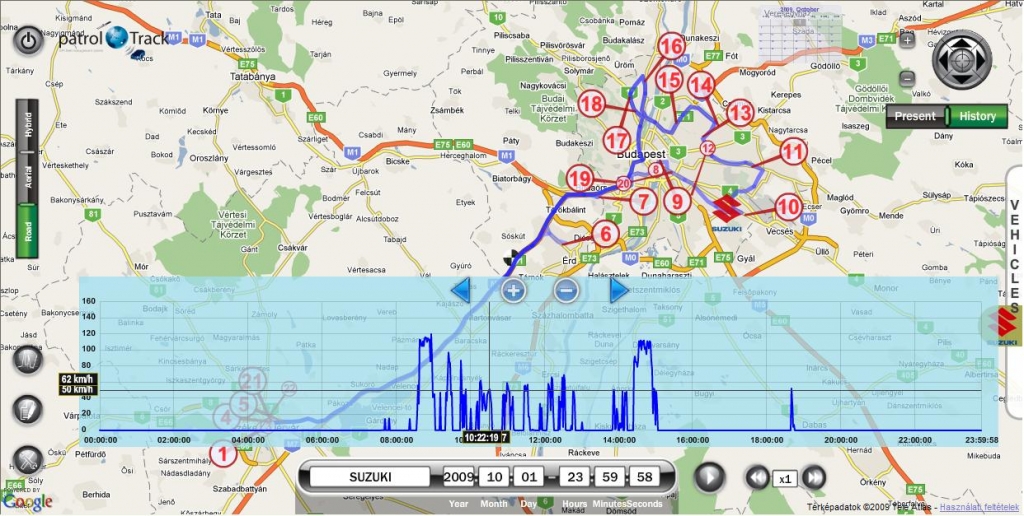
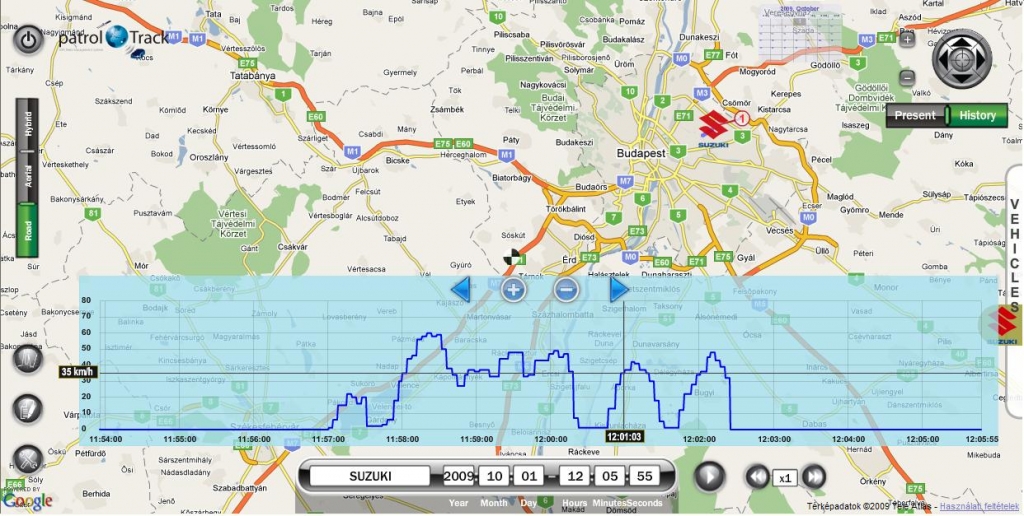
The graphical representation of the vehicles’ speed is part of the basic service of patrolTrack. The system makes 24-hour graphs by GPS from the speed measured by the satellite. With its help you can check every minute of every hour of every day retroactively whether the given vehicle is over the speed limit. While you select the requested moment – the speed of which you would like to know - on the graphs by moving the cursor, the icon of the vehicle on the graphical representation takes you to the point where the vehicle was driving at the moment of the retrieval. So you can learn not only the speed, but the location, the road section where something happened.
The speed graphs are extremely useful because we can learn how the company vehicles are used. Clearly it will have a huge role in the conservation of the vehicles, in the decrease of its amortization costs and fuel consumption, and you will see if the drivers step on the gas pedal with a big foot.
|
|
A patrolTrack flottakövető rendszer tökéletes megoldás az Ön flottájának JELEN idejű és MÚLT idejű nyomon követésére egyaránt. Interneten keresztül, gyorsan és egyszerűen ellenőrizhetőek a gépjármű adatok.
|
A patrolTrack flottakövető rendszer az Állami Autópálya Kezelővel (ÁAK) kötött szerződésünk értelmében elfogadott és alkalmas az E-útdíj bevallásához.
|
|
Gépkocsija vagy flottája által megtett útvonalakból, a patrolTrack rendszer pillanatok alatt képes útnyilvántartást készíteni. Elegendő kiválasztani a kívánt járművet, majd beállítani a lekérdezendő időszakot és a rendszer professzionális útnyilvántartást készít automatikusan.
|
A patrolTrack alapszolgáltatásához tartozik a gépjárművek sebességének grafikonszerű ábrázolása. A GPS által, műholdon mért sebességből a rendszer 24 órás grafikont készít.
|
|
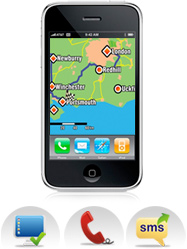
Kövesse flottáját okostelefonon keresztül rendkívül könnyen és egyszerűen.
|
A patrolTrack egység önállóan és riasztóval összekötve is képes, riasztási eseményekről értesítést küldeni. A felhasználó igénye szerint a riasztásokról sms-ben, telefonon és saját diszpécser központra kaphat értesítést.
|
|
A patrolTrack rendszer felhasználóinak lehetőségük van saját POI pontokat, területeket beállítani.
| |
|
A saját POI pontok beállításával párhuzamosan a felhasználók kijelölhetnek tiltott zónákat is.
|
Ezzel a funkcióval felhasználói szinteket lehet létrehozni, melyben különböző jogosultsági kategóriákra oszthatók azok a munkatársak, akik az Ön cégénél a gépkocsik mozgását figyelik.
|
|
Ha nincs internet közelében, de azonnal tudni szeretné egy gépkocsija pillanatnyi helyzetét, pozícióját, indítson egy ingyenes hívást, és sms-ben máris jönnek az adatok.
|
|
|
PATROLLINE KFT
8000 Székesfehérvár, Királysor 30. HU І Tel/Fax: +3622/317-367, +3622/503-078
E-mail: info@patroltrack.eu І Web: www.patroltrack.eu
© MINDEN JOG FENNTARTVA!
|
|